
A few days ago I had the privilege of presenting at OAME in Ottawa on the topic of “Making Math Visual”. If interested, here are some of my talking points for you to reflect on:
To get us started, we discussed an image created by Christopher Danielson and asked the group what they noticed:

We noticed quite a lot in the image… and did a “how many” activity sharing various numbers we saw in the image. After our discussions I explained that I had shared the same picture with a group of parents at a school’s parent night followed by the next picture.
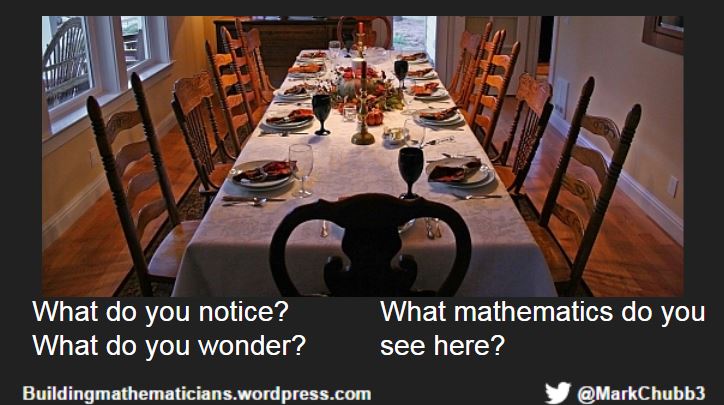
The picture above was more difficult for us as teachers to see the mathematics. While we, as math teachers, saw patterns in the placements of utensils, shapes and angles around the room, quantities of countable items, multiplicative relationships between utensils and place settings, volume of wine glasses, differences in heights of chairs, perimeter around the table….. the group correctly guessed that many parents do not typically notice the mathematics around them.
So, my suggestion for the teachers in the room was to help change this:

While I think it is important that we tackle the idea of seeing the world around us as being mathematical, a focus on making math visual needs to by MUCH more than this. To illustrate the kinds of visuals our students need to be experiencing, we completed a simple task independently:

After a few minutes of thinking, we discussed research of the different ways we use fractions, along with the various visuals that are necessary for our students to explore in order for them to develop as fractional thinkers:


When we looked at the ways we typically use fractions, it’s easy to notice that WE, as teachers, might need to consider how a focus on representations might help us notice if we are providing our students with a robust (let’s call this a “relational“) view of the concepts our students are learning about.

Data taken from 1 school’s teachers:

Above you see the 6 ways of visualizing fractions, but if you zoom in, you will likely notice that much of the “quotient” understanding doesn’t include a visual at all… Really, the vast majority of fractional representations here from this school were “Part – Whole relationships (continuous) models”. If, our goal is to “make math visual” then I believe we really need to spend more time considering WHICH visuals are going to be the most helpful and how those models progress over time!
We continued to talk about Liping Ma’s work where she asked teachers to answer and represent the following problem:

As you can see, being able to share a story or visual model for certain mathematics concepts seems to be a relative need. My suggestion was to really consider how a focus on visual models might be a place we can ALL learn from.
We then followed by a quick story of when a student told me that the following statement is true (click here for the full story) and my learning that came from it!

So, why should we focus on making math visual?

We then explored a statement that Jo Boaler shared in her Norms document:

…and I asked the group to consider if there is something we learn in elementary school that can’t be represented visually?
If you have an idea to the previous question, I’d love to hear it, because none of us could think of a concept that can’t be represented visually.
I then shared a quick problem that grade 7 students in one of my schools had done (see here for the description):

Along with a few different responses that students had completed:

Most of the students in the class had responded much like the image above. Most students in the class had confused linear metric relationships (1 meter = 100 cm) with metric units of area (1 meter squared is NOT the same as 100cm2).

In fact, only two students had figured out the correct answer… which makes sense, since the students in the class didn’t learn about converting units of area through visuals.

If you are wanting to help think about HOW to “make math visual”, below is some of the suggestions we shared:


And finally some advice about what we DON’T mean when talking about making mathematics visual:


You might recognize the image above from Graham Fletcher’s post/video where he removed all of the fractional numbers off each face in an attempt to make sure that the tools were used to help students learn mathematics, instead of just using them to get answers.

I want to leave you with a few reflective questions:
- Can all mathematics concepts in elementary be represented visually?
- Why might a visual representation be helpful?
- If a student can get a correct answer, but can’t represent what is going on, do they really “understand” the concept?
- Are some representations more helpful than others?
- How important is it that our students notice the mathematics around them?
- How might a focus on visual representations help both us and our students deepen our understanding of the mathematics we are teaching/learning?
- Where do you turn to help you learn more about or get specific examples of how to effectively use visuals?
I’d love to continue the conversation. Feel free to write a response, or send me a message on Twitter ( @markchubb3 ).
If you are interested in all of the slides, you can take a look here

One thought on ““Making Math Visual””