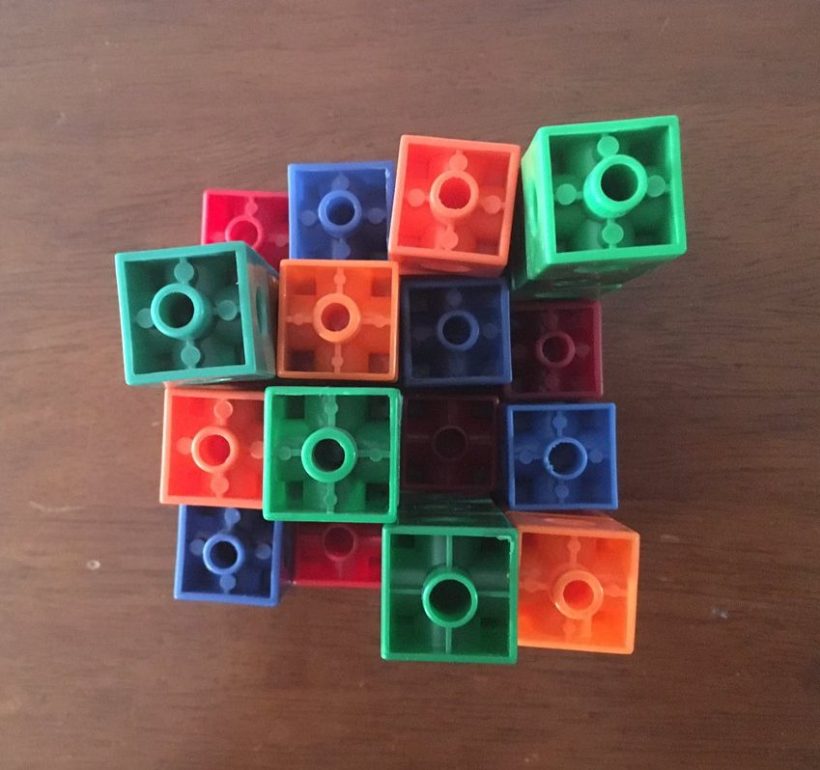
Central Tendencies Puzzles

Central Tendency Puzzle templates for you to check out. I’d love to hear some feedback on these.

Data management is becoming an increasingly important topic as our students try to make sense of news, social media posts, advertisements… Especially as more and more of these sources aim to try to convince you to believe something (intentionally or not).

Part of our job as math teachers needs to include helping our students THINK as they are collecting / organizing / analyzing data. For example, when looking at data we want our students to:

  • Notice the writer’s choice of scale(s)
  • Notice the decisions made for categories
  • Notice which data is NOT included
  • Notice the shape of the data and spatial / proportional connections (twice as much/many)
  • Notice the choice of type of graph chosen
  • Notice irregularities in the data
  • Notice similarities among or between data
  • Consider ways to describe the data as a whole (i.e., central tendency) or the story it is telling over time (i.e., trends)

While each of these points are important, I’d like to offer a way we can help our students explore the last piece from above – central tendencies.

Central Tendency Puzzle Templates

To complete each puzzle, you will need to make decisions about where to start, which numbers are most likely and then adjust based on what makes sense or not. I’d love to have some feedback on the puzzles.

Linked here are the Central Tendencies Puzzles.

Questions to Reflect on:

  • How will your students be learning about central tendencies before doing these puzzles? What kinds of experience might lead up to these puzzles? (See A Few Simple Beliefs)
  • How might puzzles like these offer your students practice for the skills they have been learning? (See purposeful practice)
  • How might puzzles like this relate to playing Skyscraper puzzles?
  • What is the current balance of questions / problems in your class? Are your students spending more time calculating, or deciding on which calculations are important? What balance would you like?
  • How might these puzzles help you meet the varied needs within a mixed ability classroom?
  • If students start to understand how to solve one of these, would you consider asking your students to make up their own puzzles? (Ideas for making your own problems here).
  • How do these puzzles help your students build their mathematical intuitions? (See ideas here)
  • Would you want students to work alone, in pairs, in groups? Why?
  • Would you prefer all of your students doing the same puzzle / game / problem, or have many puzzles / games / problems to choose from? How might this change class conversations afterward?
  • How will you consolidate the learning afterward? (See Never Skip the Closing of the Lesson)
  • As the teacher, what will you be doing when students are playing? How might listening to student thinking help you learn more about your students? (See: Noticing and Wondering: A powerful tool for assessment)

I’d love to continue the conversation about these puzzles.  Leave a comment here or on Twitter @MarkChubb3
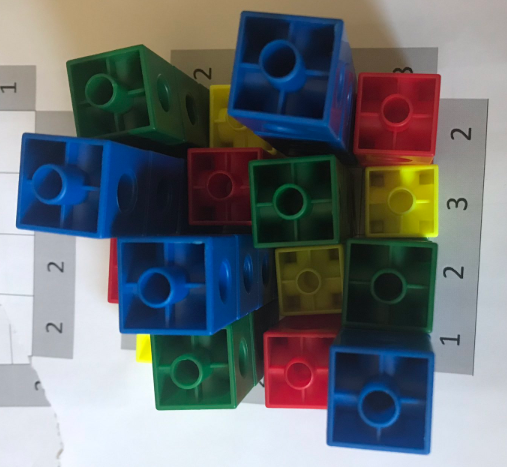
Skyscraper Puzzles – printable package

An area of mathematics I wish more students had opportunities to explore is spatial/visualization. There are many studies that show just how important spatial/visual reasoning is for mathematical success (I discuss in more depth here), but often, we as teachers aren’t sure where to turn to help our students develop spatial reasoning, or now to make the mathematics our students are learning more spatial.

One such activity I’ve suggested before is Skyscraper Puzzles. I’ve shared these puzzles before (Skyscraper Puzzles and Skyscraper Templates – for relational rods). With the help of my own children, I decided to make new templates. The package includes a page dedicated to explain how to solve the puzzles, as well as instructions on each page.

For details about how to solve a Skyscraper Puzzle, please click here

New Puzzles can be accessed here

*The above files are open to view / print. If you experience difficulties accessing, you might need to use a non-educational account as your school board might be restricting your access.

You’ll notice in the package above that some of the puzzles are missing information like the puzzle below:

Puzzles like these might include information within the puzzle. In the puzzle above, the 1 in the middle of the block refers to the height of that tower (a tower with a height of 1 goes where the 1 is placed).

You might also be interested in watching a few students discussing how to play:

A few thoughts about how you might use these:

As always, I’d love to hear from you. Feel free to write a response, or send me a message on Twitter ( @markchubb3 ).

“Making Math Visual”

A few days ago I had the privilege of presenting at OAME in Ottawa on the topic of “Making Math Visual”.   If interested, here are some of my talking points for you to reflect on:

To get us started, we discussed an image created by Christopher Danielson and asked the group what they noticed:

a2

We noticed quite a lot in the image… and did a “how many” activity sharing various numbers we saw in the image.  After our discussions I explained that I had shared the same picture with a group of parents at a school’s parent night followed by the next picture.

a3

The picture above was more difficult for us as teachers to see the mathematics. While we, as math teachers, saw patterns in the placements of utensils, shapes and angles around the room, quantities of countable items, multiplicative relationships between utensils and place settings, volume of wine glasses, differences in heights of chairs, perimeter around the table…..  the group correctly guessed that many parents do not typically notice the mathematics around them.

So, my suggestion for the teachers in the room was to help change this:

a5

While I think it is important that we tackle the idea of seeing the world around us as being mathematical, a focus on making math visual needs to by MUCH more than this. To illustrate the kinds of visuals our students need to be experiencing, we completed a simple task independently:

a6

After a few minutes of thinking, we discussed research of the different ways we use fractions, along with the various visuals that are necessary for our students to explore in order for them to develop as fractional thinkers:

When we looked at the ways we typically use fractions, it’s easy to notice that WE, as teachers, might need to consider how a focus on representations might help us notice if we are providing our students with a robust (let’s call this a “relational“) view of the concepts our students are learning about.

a13

Data taken from 1 school’s teachers:

a14

Above you see the 6 ways of visualizing fractions, but if you zoom in, you will likely notice that much of the “quotient” understanding doesn’t include a visual at all… Really, the vast majority of fractional representations here from this school were “Part – Whole relationships (continuous) models”. If, our goal is to “make math visual” then I believe we really need to spend more time considering WHICH visuals are going to be the most helpful and how those models progress over time!

We continued to talk about Liping Ma’s work where she asked teachers to answer and represent the following problem:

a15

As you can see, being able to share a story or visual model for certain mathematics concepts seems to be a relative need. My suggestion was to really consider how a focus on visual models might be a place we can ALL learn from.

We then followed by a quick story of when a student told me that the following statement is true (click here for the full story) and my learning that came from it!

a17

So, why should we focus on making math visual?

a18

We then explored a statement that Jo Boaler shared in her Norms document:

a19

…and I asked the group to consider if there is something we learn in elementary school that can’t be represented visually?

If you have an idea to the previous question, I’d love to hear it, because none of us could think of a concept that can’t be represented visually.


I then shared a quick problem that grade 7 students in one of my schools had done (see here for the description):

a20

Along with a few different responses that students had completed:

a21

Most of the students in the class had responded much like the image above.  Most students in the class had confused linear metric relationships (1 meter = 100 cm) with metric units of area (1 meter squared is NOT the same as 100cm2).

a22

In fact, only two students had figured out the correct answer… which makes sense, since the students in the class didn’t learn about converting units of area through visuals.

a23

If you are wanting to help think about HOW to “make math visual”, below is some of the suggestions we shared:

a25
a26

And finally some advice about what we DON’T mean when talking about making mathematics visual:

a27
a28

You might recognize the image above from Graham Fletcher’s post/video where he removed all of the fractional numbers off each face in an attempt to make sure that the tools were used to help students learn mathematics, instead of just using them to get answers.

a29

I want to leave you with a few reflective questions:

  • Can all mathematics concepts in elementary be represented visually?
  • Why might a visual representation be helpful?
  • If a student can get a correct answer, but can’t represent what is going on, do they really “understand” the concept?
  • Are some representations more helpful than others?
  • How important is it that our students notice the mathematics around them?
  • How might a focus on visual representations help both us and our students deepen our understanding of the mathematics we are teaching/learning?
  • Where do you turn to help you learn more about or get specific examples of how to effectively use visuals?

I’d love to continue the conversation.  Feel free to write a response, or send me a message on Twitter ( @markchubb3 ).


If you are interested in all of the slides, you can take a look here

Making Math Visual

A few days ago I had the privilege of presenting at MAC2 to a group of teachers in Orillia on the topic of “Making Math Visual”.   If interested, here are some of my talking points for you to reflect on:a1

To get us started I shared an image created by Christopher Danielson and asked the group what they noticed:

a2

We noticed quite a lot in the image… and did a “how many” activity sharing various numbers we saw in the image.  After our discussions I explained that I had shared the same picture with a group of parents at a school’s parent night followed by the next picture.

a3

I asked the group of teachers what mathematics they noticed here… then how they believed parents might have answered the question.  While we, as math teachers, saw patterns in the placements of utensils, shapes and angles around the room, quantities of countable items, multiplicative relationships between utensils and place settings, volume of wine glasses, differences in heights of chairs, perimeter around the table…..  the group correctly guessed that many parents do not typically notice the mathematics around them.

So, my suggestion for the teachers in the room was to help change this:

a5

I then asked the group to do a simple task for us to learn from:

a6

After a few minutes of thinking, I shared some research of the different ways we use fractions:

When we looked at the ways we typically use fractions, it’s easy to notice that WE, as teachers, might need to consider how a focus on representations might help us notice if we are providing our students with a robust (let’s call this a “relational“) view of the concepts our students are learning about.

a13

Data taken from 1 school’s teachers:

a14

We continued to talk about Liping Ma’s work where she asked teachers to answer and represent the following problem:

a15

Followed by a quick story of when a student told me that the following statement is true (click here for the full story).

a17

So, why should we focus on making math visual?

a18


We then explored a statement that Jo Boaler shared in her Norms document:

a19

…and I asked the group to consider if there is something we learn in elementary school that can’t be represented visually?

If you have an idea to the previous question, I’d love to hear it, because none of us could think of a concept that can’t be represented visually.


I then shared a quick problem that grade 7 students in one of my schools had done (see here for the description):

a20

Along with a few different responses that students had completed:

a21

Most of the students in the class had responded much like the image above.  Most students in the class had confused linear metric relationships (1 meter = 100 cm) with metric units of area (1 meter squared is NOT the same as 100cm2).

a22

In fact, only two students had figured out the correct answer… which makes sense, since the students in the class didn’t learn about converting units of area through visuals.

a23

We wrapped up with a few suggestions:

a25

a26

And finally some advice about what we DON’T mean when talking about making mathematics visual:

a27

a28

You might recognize the image above from Graham Fletcher’s post/video where he removed all of the fractional numbers off each face in an attempt to make sure that the tools were used to help students learn mathematics, instead of just using them to get answers.

a29


I want to leave you with a few reflective questions:

  • Can all mathematics concepts in elementary school be represented visually?
  • Why might a visual representation be helpful?
  • Are some representations more helpful than others?
  • How important is it that our students notice the mathematics around them?
  • How might a focus on visual representations help both us and our students deepen our understanding of the mathematics we are teaching/learning?

I’d love to continue the conversation.  Feel free to write a response, or send me a message on Twitter ( @markchubb3 ).


If you are interested in all of the slides, you can take a look here


The Importance of Contexts and Visuals

My wife Anne-Marie isn’t always impressed when I talk about mathematics, especially when I ask her to try something out for me, but on occasion I can get her to really think mathematically without her realizing how much math she is actually doing.  Here’s a quick story about one of those times, along with some considerations:


A while back Anne-Marie and I were preparing lunch for our three children.  It was a cold wintery day, so they asked for Lipton Chicken Noodle Soup.  If you’ve ever made Lipton Soup before you would know that you add a package of soup mix into 4 cups of water.

Lipton soup

Typically, my wife would grab the largest of our nesting measuring cups (the one marked 1 cup), filling it four times to get the total required 4 cups, however, on this particular day, the largest cup available was the 3/4 cup.

nesting cups.JPG

Here is how the conversation went:

Anne-Marie:  How many of these (3/4 cups) do I need to make 4 cups?

Me:  I don’t know.  How many do you think?  (attempting to give her time to think)

Anne-Marie:  Well… I know two would make a cup and a half… so… 4 of these would make 3 cups…

Me: OK…

Anne-Marie:  So, 5 would make 3 and 3/4 cups.

Me:  Mmhmm….

Anne-Marie:  So, I’d need a quarter cup more?

Me:  So, how much of that should you fill?  (pointing to the 3/4 cup in her hand)

Anne-Marie:  A quarter of it?  No, wait… I want a quarter of a cup, not a quarter of this…

Me:  Ok…

Anne-Marie:  Should I fill it 1/3 of the way?

Me:  Why do you think 1/3?

Anne-Marie:  Because this is 3/4s, and I only need 1 of the quarters.


The example I shared above illustrates sense making of a difficult concept – division of fractions – a topic that to many is far from our ability of sense making.  My wife, however, quite easily made sense of the situation using her reasoning instead of a formula or an algorithm.  To many students, however, division of fractions is learned first through a set of procedures.

I have wondered for quite some time why so many classrooms start with procedures and algorithms unill I came across Liping Ma’s book Knowing and Teaching Mathematics.  In her book she shares what happened when she asked American and Chinese teachers these 2 problems:

liping ma1

Here were the results:

Liping ma2

Now, keep in mind that the sample sizes for each group were relatively small (23 US teachers and 72 Chinese teachers were asked to complete two tasks), however, it does bring bring about a number of important questions:

  • How does the training of American and Chinese teachers differ?
  • Did both groups of teachers rely on the learning they had received as students, or learning they had received as teachers?
  • What does it mean to “Understand” division of fractions?  Computing correctly?  Beging able to visually represent what is gonig on when fractions are divided? Being able to know when we are being asked to divide?  Being able to create our own division of fraction problems?
  • What experiences do we need as teachers to understand this concept?  What experiences should we be providing our students?

Visual Representations

In order to understand division of fractions, I believe we need to understand what is actually going on.  To do this, visuals are a necessity!  A few examples of visual representations could include:

A number line:

three quarters NL

A volume model:

GlassMeasuringCup32oz117022_x

An area model:


Starting with a Context

Starting with a context is about allowing our students to access a concept using what they already know (it is not about trying to make the math practical or show students when a concept might be used someday).  Starting with a context should be about inviting sense-making and thinking into the conversation before any algorithm or set of procedures are introduced.  I’ve already shared an example of a context (preparing soup) that could be used to launch a discussion about division of fractions, but now it’s your turn:

Design your own problem that others could use to launch a discussion of division of fractions.  Share your problem!  


A few things to reflect on:

As always, I’d love to hear your thoughts.  Leave a reply here on Twitter (@MarkChubb3)

…a child first has to learn the foundational skills of math, like______?

I’ve been spending a lot of time lately observing students who struggle with mathematics, talking with teachers about their students who struggle, and thinking about how to help.  There are several students in my schools who experience difficulties beyond what we might typically do to help.  And part of my role is trying to think about how to help these students.  It seems that at the heart of this problem, we need to figure out where our students are in their understanding, then think about the experiences they need next.

However, first of all I want to point out just how difficult it is for us to even know where to begin!  If I give a fractions quiz, I might assume that my students’ issues are with fractions and reteach fractions… If I give them a timed multiplication test, I might assume that their issues are with their recall of facts and think continued practice is what they need… If I give them word problems to solve, I might assume that their issue is with reading the problem, or translating a skill, or with the skill itself…….  Whatever assessment I give, if I’m looking for gaps, I’ll find them!

So where do we start?  What are the foundations on which the concepts and skills you are doing in your class rest on?  This is an honest question I have.

Take a look at the following quote.  How would you fill in the blank here?


foundational-skills-1

Really, take a minute to think about this.  Write down your thoughts.  In your opinion, what are the foundational skills of math?  Why do you believe this?  This is something I’ve really been reflecting on and need to continue doing so.


I’ve asked a few groups of teachers to fill in the blank here in an effort to help us consider our own beliefs about what is important.  To be honest, many of the responses have been very thoughtful and showcased many of the important concepts and skills we learn in mathematics.  However, most were surprised to read the full paragraph (taken from an explanation of dyscalculia).


Here is the complete quote:

foundational-skills-2
Taken from Dyscalculia Headlines


Is this what you would have thought?  For many of us, probably not. In fact, as I read this, I was very curious what they meant by visual perception and visual memory.  What does this look like?  When does this begin?  How do we help if these are missing pieces later?

Think about it for a minute.  How might you see these as the building blocks for later math learning?  What specifically do these look like?  Here are two excerpts from Taking Shape that might help:

taking-shape-quote-2
Excerpt from Taking Shape

taking-shape-quote-1
Excerpt from Taking Shape


Visual perception and visual memory are used when we are:

  • Perceptual Subitizing (seeing a small amount of objects and knowing how many without need of counting)
  • Conceptual subitizing (the ability to organize or reorder objects in your mind. To take perceptual subitizing to make sense of visuals we don’t know)
  • Comparing objects’ sizes, distances, quantities…
  • Composing & decomposing shape (both 2D or 3D)
  • Recognizing, building, copying symmetry designs (line or rotational)
  • Recognizing & performing rotations & reflections.
  • Constructing & recognizing objects from different perspectives
  • Orienting ourselves, giving & following directions from various perspectives.
  • Visualizing 3D figures given 2D nets

While much of this can be quite complicated (if you want, you can take a quick test here), for some of our students the visual perception and visual memory is not yet developed and need time and experiences to help them mature. Hopefully we can see how important these as for future learning.  If we want our students to be able to compose and decompose numbers effectively, we need lots of opportunities to compose and decompose shapes first!  If we want our students to understand quantity, we need to make sure those quantities make sense visually and conceptually. If we want students to be flexible thinkers, we need to start with spatial topics that allow for flexibility to be experienced visually.  If we want students to be successful we can’t ignore just how important developing their spatial reasoning is!


In our schools we have been taking some of the research on Spatial Reasoning and specifically from the wonderful resource Taking Shape and putting it into action.  I will be happy to share our findings and action research soon.  For now, take a look at some of the work we have done to help our students develop their visual perception and visual memory:

Symmetry games:


Composing and decomposing shapes:

Relating nets to 3D figures:

Constructing unique pentominoes:


And the work in various grades continues to help support all of our students!


So I leave you with a few questions:

  • What do you do with students who are really struggling with their mathematics?  Have you considered dyscalculia and the research behind it?
  • How might you incorporate spatial reasoning tasks / problems for all students more regularly?
  • Where in your curriculum / standards are students expected to be able to make sense of things visually?  (There might be much more here than we see at first glance)
  • How does this work relate to our use of manipulatives, visual models and other representations?
  • What do we do when we notice students who have visual perception and visual memory issues beyond what is typical?
  • How can Doug Clements’ trajectories help us here?
  • If we spend more time early with students developing their visual memory and visual perception, will fewer students struggle later???

I’d love to hear your thoughts.  Leave a comment here or on Twitter (@MarkChubb3).