A few days ago I had the privilege of presenting at MAC2 to a group of teachers in Orillia on the topic of “Making Math Visual”. If interested, here are some of my talking points for you to reflect on:
To get us started I shared an image created by Christopher Danielson and asked the group what they noticed:

We noticed quite a lot in the image… and did a “how many” activity sharing various numbers we saw in the image. After our discussions I explained that I had shared the same picture with a group of parents at a school’s parent night followed by the next picture.

I asked the group of teachers what mathematics they noticed here… then how they believed parents might have answered the question. While we, as math teachers, saw patterns in the placements of utensils, shapes and angles around the room, quantities of countable items, multiplicative relationships between utensils and place settings, volume of wine glasses, differences in heights of chairs, perimeter around the table….. the group correctly guessed that many parents do not typically notice the mathematics around them.
So, my suggestion for the teachers in the room was to help change this:

I then asked the group to do a simple task for us to learn from:

After a few minutes of thinking, I shared some research of the different ways we use fractions:


When we looked at the ways we typically use fractions, it’s easy to notice that WE, as teachers, might need to consider how a focus on representations might help us notice if we are providing our students with a robust (let’s call this a “relational“) view of the concepts our students are learning about.

Data taken from 1 school’s teachers:

We continued to talk about Liping Ma’s work where she asked teachers to answer and represent the following problem:

Followed by a quick story of when a student told me that the following statement is true (click here for the full story).

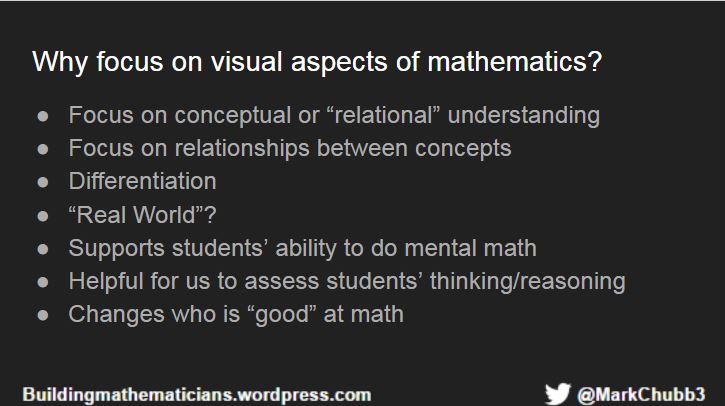
So, why should we focus on making math visual?

We then explored a statement that Jo Boaler shared in her Norms document:

…and I asked the group to consider if there is something we learn in elementary school that can’t be represented visually?
If you have an idea to the previous question, I’d love to hear it, because none of us could think of a concept that can’t be represented visually.
I then shared a quick problem that grade 7 students in one of my schools had done (see here for the description):
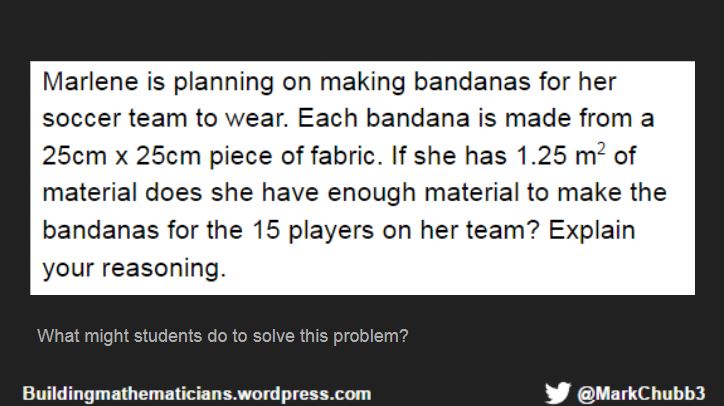
Along with a few different responses that students had completed:

Most of the students in the class had responded much like the image above. Most students in the class had confused linear metric relationships (1 meter = 100 cm) with metric units of area (1 meter squared is NOT the same as 100cm2).

In fact, only two students had figured out the correct answer… which makes sense, since the students in the class didn’t learn about converting units of area through visuals.

We wrapped up with a few suggestions:

And finally some advice about what we DON’T mean when talking about making mathematics visual:


You might recognize the image above from Graham Fletcher’s post/video where he removed all of the fractional numbers off each face in an attempt to make sure that the tools were used to help students learn mathematics, instead of just using them to get answers.

I want to leave you with a few reflective questions:
- Can all mathematics concepts in elementary school be represented visually?
- Why might a visual representation be helpful?
- Are some representations more helpful than others?
- How important is it that our students notice the mathematics around them?
- How might a focus on visual representations help both us and our students deepen our understanding of the mathematics we are teaching/learning?
I’d love to continue the conversation. Feel free to write a response, or send me a message on Twitter ( @markchubb3 ).
If you are interested in all of the slides, you can take a look here

This is a phenomenal post! I am so grateful to receive it; thank you for sharing!
Sent from my iPad
>
LikeLike
(I put this on the link as well)
Just two thoughts about Marlene’s problem:
1. 25cm won’t go round a grade 7 kid.
2. What is 1.25Msquared? The actual dimensions are crucial.
and for a bonus solve two simultaneous equations.
Good stuff, if “training” is not the important aspect.
LikeLike
A lot of really important stuff here. Visualization is often the key to understanding and solving problems. Those of us who engage in problem solving know this. Unfortunately, many teachers do not “walk the talk.” How many times have we seen teachers struggle mightily with solving problems, because they don’t engage in problem solving themselves?
I love the “cute and colorful doesn’t mean it’s mathematically important” part as we hear “oh this is a cute worksheet” a lot.
I hope to use thisin an upcoming PLC.
LikeLike
I also thought “ok, 1.25 square meters, but if it’s a long thing 20 cm wide, won’t work,” but that’s because I look for stuff like that.
I’m supposed to talk about making math visual next Wednesday and had decided my first “reason for doing it” was conversions from linear to square measurements. I have Sarah Carter’s awesome “perfect square” and “perfect Cube” posters on my wall (embellished with a first power and zero power row, too), and showing a “square yard” as nine square feet is usually pretty instantly enlightening.
LikeLike
Thank you for this post ~ its visual nature makes it a powerful PD resource!
LikeLike
The best way for kids to learn anything is through play – they may not even realize they are learning. A game with great graphics gives kids a visual that helps them understand and remember a math concept like negative numbers better.
LikeLike
how to study maths
LikeLike
Math is everywhere and if kids can start to see that with our guidance they will start to explore on their own with a new “vision” of what math can be.
LikeLike